One of the most common questions Darwin solar owners ask is: " How do I know if my system is actually working as it should? A solar panel installation does not come with an automatic notification when performance drops — and in Darwin’s complex climate, underperformance can develop gradually and go unnoticed for months. Homeowners who invest in solar in Darwin deserve a system that delivers on its promised return, and the only way to guarantee that is through regular, structured solar performance checks. This guide gives Darwin, Palmerston, Alice Springs, Katherine, and Tennant Creek homeowners the exact framework to assess their system’s performance at any time of year.
Why Performance Monitoring Matters for Darwin Solar Homeowners
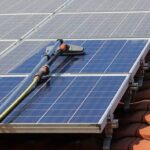
Darwin’s unique combination of extreme heat, high humidity, heavy storms, and significant dust accumulation creates performance challenges that southern state homeowners simply do not face. A system that was delivering 32 kWh per day in January 2025 should be delivering comparable figures in March 2026 after accounting for seasonal variation. If it is not, something has changed. Common causes of undetected underperformance in Darwin include progressive soiling, partial shading from growing vegetation, surge-damaged solar inverters Darwin, heat-related output losses, and degraded battery storage Darwin performance. Without a systematic performance check process, these issues can go unresolved for a full year or more.
| System Size | Expected Daily Output (Dry Season) | Expected Daily Output (Wet Season) | Annual Expected Output |
| 5kW system | 22–27 kWh | 16–20 kWh | 7,500–8,500 kWh |
| 6.6kW system | 28–35 kWh | 20–25 kWh | 9,500–10,500 kWh |
| 10kW system | 42–50 kWh | 30–38 kWh | 14,000–16,000 kWh |
| 13.3kW system | 55–65 kWh | 40–50 kWh | 18,000–21,000 kWh |
How to Read Your Solar Monitoring App
Most modern inverters sold in Darwin come with a companion smartphone app that provides real-time and historical generation data. Understanding how to read this data is the foundation of effective solar performance checking. The three most important metrics to understand are daily generation (kWh), system power right now (kW), and historical daily averages. Each of these tells a different story about your system’s health.
Daily Generation (kWh)
Your daily generation figure is the total number of kilowatt hours your solar panel installation Darwin system produced in a calendar day. Compare this to the expected figures in the table above, adjusting for seasonal variation and recent weather. If your daily generation is consistently 20 per cent or more below the expected range for the current season, a performance issue is likely.
Important Read: Solar in Darwin: The Complete 2026 Guide for NT Homeowners
Real-Time Power Output (kW)
Real-time power output shows how many kilowatts your system is producing at this exact moment. On a clear Darwin dry season day between 9 am and 3 pm, a 6.6kW system should be producing 4 to 6kW continuously. Output that peaks much lower than this, or drops irregularly during clear sunny periods, indicates a fault in one or more panels, or an inverter issue that warrants a professional solar performance check, Darwin.
Historical Daily Averages
Historical averages allow you to compare current performance against the same period in previous years. A well-maintained Darwin solar system should show stable or very gradually declining annual averages (less than 0.5 per cent per year is normal degradation). A sudden step-change downward in the historical trend is a clear signal that something has changed in the system, and a professional assessment is needed.
Key Performance Benchmarks for Darwin Solar Systems in 2026
The following benchmarks have been developed specifically for Darwin’s climate, based on average peak sun hours and typical system performance data for the Top End. Use these as reference points when carrying out your regular solar system service maintenance Darwin checks. If your system consistently falls below these figures without an obvious weather explanation, contact Oneroof Solar for a professional assessment.
| Check Period | Healthy Performance Range | Marginal Performance | Action Required |
| Dry season daily output (6.6kW) | 28–35 kWh/day | 22–28 kWh/day | Below 22 kWh: professional check needed |
| Wet season daily output (6.6kW) | 18–25 kWh/day | 14–18 kWh/day | Below 14 kWh: professional check needed |
| Peak midday output (6.6kW, clear day) | 4.5–6kW | 3–4.5kW | Below 3kW mid-morning: inspect immediately |
| Annual output (6.6kW) | 9,500–10,500 kWh | 8,000–9,500 kWh | Below 8,000 kWh: major fault likely |
| Battery SOC (13.5kWh) at midday | 70–90% in dry season | 50–70% | Below 50% consistently: battery or panel fault |
Warning Signs Your Darwin Solar System is Underperforming
Beyond monitoring app data, there are physical and behavioural signs that your solar panel maintenance Darwin schedule should watch for. Electricity bills that are creeping up despite no change in usage habits are one of the most reliable real-world indicators. Grid draw that is higher than expected during daylight hours, batteries that are not reaching expected charge levels, and inverter lights showing amber or red status are all reasons to initiate a formal solar performance check, Darwin.
| Warning Sign | Possible Cause | Urgency | Recommended Action |
| Electricity bills rising with same usage | System underperforming or fault present | High | Book professional performance assessment |
| High grid draw during sunny daytime hours | Inverter fault or major panel issue | Very High | Contact Oneroof Solar immediately |
| Battery not reaching 80%+ in dry season | Panel performance issue or battery degradation | Medium | Check monitoring app; book assessment |
| Inverter showing amber or red indicator | Error condition present | High | Check inverter screen for error code |
| Inverter making clicking or buzzing sounds | Internal component fault | Very High | Book urgent |
| Generation drops sharply after a storm | Surge damage to inverter or SPD | Very High | Post-storm professional inspection needed |
DIY Performance Checks You Can Do Yourself
While a professional assessment from qualified solar installers in Darwin is the most reliable way to confirm system health, there are several checks Darwin homeowners can perform themselves on a monthly basis. These checks require no technical expertise and take less than ten minutes using your inverter monitoring app.
| DIY Check | How to Do It | What to Look For | Frequency |
| Daily generation review | Open inverter app and check yesterday’s kWh total | Compare to benchmark for season and weather | Weekly |
| Real-time output check | Check app during a clear sunny morning between 10am–12pm | Should be near system rated capacity | Monthly |
| Bill vs expected savings review | Compare current bill to pre-solar bill adjusted for usage | Savings should be consistent season-to-season | Quarterly |
| Visual panel inspection (ground level) | Look up at panels from safe ground position | No visible damage, dark patches, or debris | Monthly |
| Inverter status light check | Check inverter status indicator colour | Green = normal; amber/red = fault condition | Weekly |
Important Read: Solar Panel Cleaning & Maintenance in Darwin: The Complete Guide to Maximizing Your System Efficiency
When to Call a Professional for a Solar Performance Check in Darwin
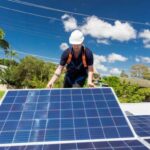
Some performance issues require professional diagnosis with specialist equipment that cannot be replicated by a DIY check. Infrared thermal imaging is used to detect hot spots in panels that are invisible to the naked eye but significantly reduce output. DC current testing identifies underperforming strings. Insulation resistance testing detects wiring faults. If your DIY checks reveal a consistent performance issue that does not resolve with cleaning, contact the repairs and maintenance team at Oneroof Solar for a comprehensive assessment. The solar panel repair Darwin team services all Darwin suburbs as well as Palmerston, Alice Springs, Katherine, and Tennant Creek.
| Performance Issue | DIY Resolution Possible? | Professional Assessment Needed? | Estimated Assessment Cost |
| Generation 10–15% below benchmark | Clean panels first | If cleaning doesn’t resolve: yes | $150–$250 |
| Generation 20%+ below benchmark | No — fault likely | Yes — book immediately | $200–$350 |
| Inverter error codes | Check manual for self-reset steps | Yes if codes persist after reset | $150–$300 |
| Zero generation on clear day | Check AC isolator is on | Yes — urgent inspection required | $200–$400 |
| Battery not charging above 50% | Check battery app settings | Yes if settings are correct | $150–$250 |
Pricing Disclaimer: All cost figures are indicative estimates for the Northern Territory market as of March 2026, and may vary based on system size, property access, and installer rates. Contact Oneroof Solar for a precise quote tailored to your specific system and location.
Frequently Asked Questions
How do I know if my Darwin solar system is underperforming?
The most reliable way to check is to compare your daily generation figures in your inverter app against the expected output benchmarks for your system size and the current season. A consistent drop of 15 per cent or more below expected figures, combined with no obvious weather explanation, indicates underperformance. Rising electricity bills despite unchanged usage habits are another reliable real-world indicator that your solar system in Darwin needs a professional performance check.
What is a normal amount of performance degradation for Darwin solar panels?
High-quality solar panels degrade at less than 0.5 per cent per year under normal conditions. After ten years, a well-maintained system should still be producing at least 95 per cent of its original rated output. Degradation rates above 1 per cent per year are a cause for concern and warrant a professional assessment. Darwin's heat can accelerate degradation in lower-quality panels, making panel brand selection important at the time of installation.
Can I check my solar system performance without a monitoring app?
Yes, but it is much harder. Without a monitoring app, you would need to manually read the inverter display each day and record the kWh total, then compare this to expected figures. You can also cross-check against your electricity bill — lower bills than expected during sunny months, or grid draw during daylight hours, both indicate performance issues. A monitoring app makes this process far easier and more accurate.
How often should I carry out a formal solar performance check in Darwin?
Monthly DIY checks via your monitoring app are recommended as a minimum. A professional performance assessment should be carried out annually, ideally combined with your pre-wet season inspection in August or September. After any significant weather event, including severe storms and near-lightning strikes, an additional performance check is advisable to identify any surge-related damage before it worsens.
My inverter is showing an error code. What should I do?
First, check your inverter manual or the manufacturer’s website for the specific error code. Many codes are self-resetting and will clear after the condition resolves (for example, a grid voltage fluctuation during a storm). If the code persists for more than 24 hours, or if the system is producing zero power, contact the solar panel repair Darwin team at Oneroof Solar for professional diagnosis. Do not attempt to open the inverter enclosure yourself.
Does Darwin’s heat affect my solar panel output?
Yes. Solar panels operate most efficiently at 25 degrees Celsius and lose approximately 0.3 to 0.5 per cent of output for every degree above this temperature. On Darwin’s hottest days, roof-mounted panels can reach 60 to 70 degrees Celsius, causing a real-world efficiency loss of 10 to 15 per cent compared to rated output. This is normal and expected. It is one of the reasons Darwin’s annual output figures are calculated using an adjusted efficiency factor rather than Standard Test Condition ratings.
Will a professional performance check find faults my app misses?
Yes. Professional solar system service maintenance Darwin assessments use specialised equipment, including infrared thermal cameras, DC clamp meters, and insulation resistance testers that can detect faults invisible to monitoring apps. Hot spots in individual cells, partial shading from micro-cracking, and insulation breakdown in DC wiring are examples of faults that monitoring apps cannot reliably identify but that a qualified technician will detect during a thorough inspection.
Verdict
A structured solar performance check Darwin routine is one of the most important habits a Darwin solar homeowner can develop. Monthly DIY monitoring checks combined with an annual professional assessment will identify faults early, maximise your system’s annual generation, and extend its operating life. Homeowners across Darwin, Palmerston, Alice Springs, Katherine, and Tennant Creek who invest the time in regular performance checking consistently report better savings outcomes and fewer unexpected repair costs. Contact the solar installers Darwin at Oneroof Solar today to schedule your 2026 annual performance assessment.
Get Your Free Solar Consultation
Contact Oneroof Solar for expert solar system performance checks in Darwin:
Darwin Office Address: Level 1/48-50 Smith St, Darwin City NT 0800
Phone: 08 8004 7888
Hours: 8 am - 6 pm (7 days)
Alice Springs Office Address: 44 Zeil St, Araluen NT 0870
Phone: 04 8393 7004
Hours: 9 am - 6 pm (Sunday closed)
Website: oneroofsolar.com.au
Serving Darwin, Palmerston, Alice Springs, Katherine, and Tennant Creek with quality solar installation services.
About the Author
This article is brought to you by the expert team at Oneroof Solar, the Northern Territory’s most trusted local solar installers and service providers. With over 200 successful installations across Darwin, Palmerston, Alice Springs, Katherine, and Tennant Creek, we are passionate about helping Territory families and businesses achieve complete energy independence through quality solar and storage solutions designed for the NT’s unique climate.